
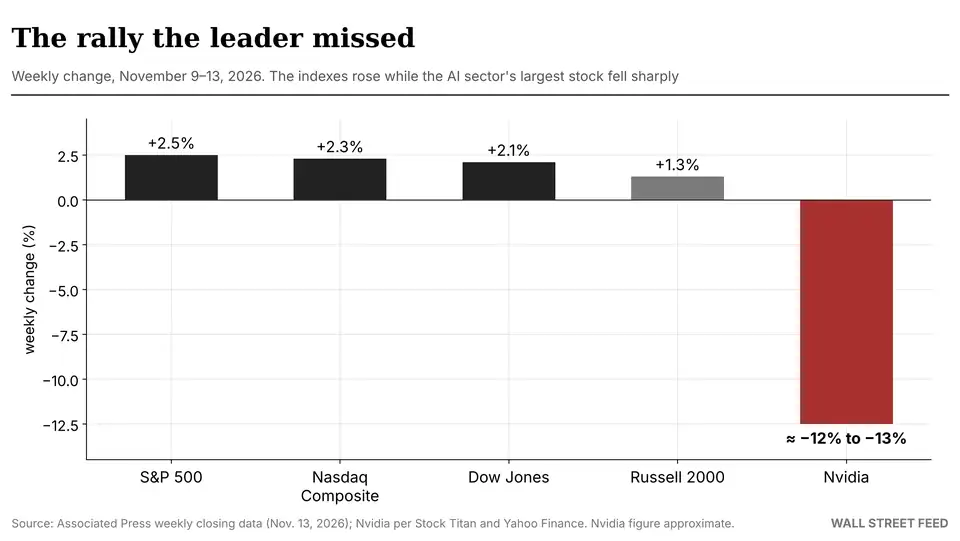
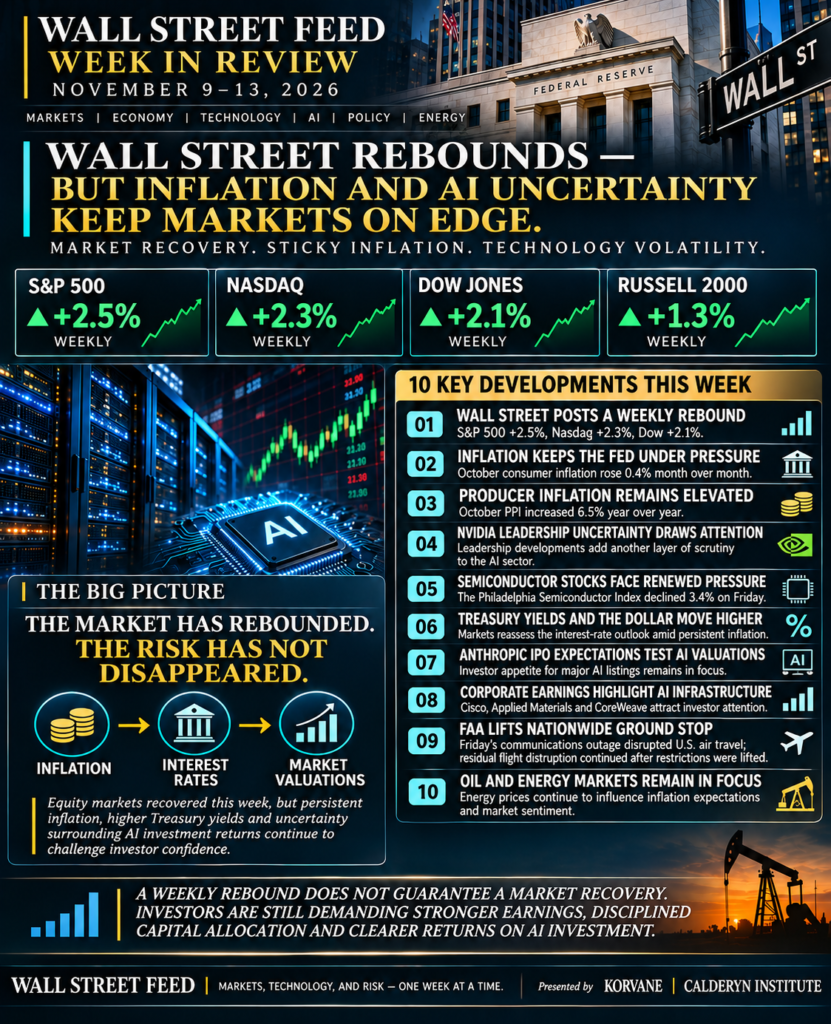
The week in one paragraph. The S&P 500 rose about 2.5%, the Nasdaq 2.3%, the Dow 2.1% and the Russell 2000 1.3%, a partial recovery from the chip crash of November 5. Under that recovery, October consumer prices rose faster than expected, the 2-year Treasury yield had its biggest one-day jump since April 2025, the 10-year crossed 5% and closed the week near 5.13%, and the futures market moved from asking whether the Fed hikes in December to asking by how much. Meanwhile Nvidia, the AI trade’s most important stock, fell about 12% to 13% and lost its chief executive.
A rebound that coincides with a 27-basis-point rise in the long bond yield, and with the sector leader falling double digits, is not the same thing as a recovery. This piece explains why.
The scoreboard
| Week | Note | |
|---|---|---|
| S&P 500 | +2.5% | Closed at 7,561.67; fell 0.4% on Friday |
| Nasdaq Composite | +2.3% | Closed at 25,136.27; fell 0.9% on Friday |
| Dow Jones | +2.1% | Closed at 52,347.55; rose 0.1% on Friday |
| Russell 2000 | +1.3% | Small caps lagged |
| Nvidia | ≈ −12% to −13% | Closed at $162.85; CEO Jensen Huang resigned Thursday |
| 10-year Treasury | ≈ 5.13% (+27bp) | Intraday high 5.17% on Friday |
| WTI crude | ≈ $88.50 (+1.9%) | |
| Gold | ≈ $3,886 (−5.6%) | |
| Bitcoin | below $70,000 | First time in nearly three months |
Two things in that table belong together. Gold fell more than 5% and Bitcoin broke below $70,000 in the same week that Treasury yields jumped. Neither asset pays a coupon. When the yield on a risk-free bond rises, the cost of holding something that pays nothing rises with it. That is the first sign that this week was about the price of money, not about any one company.
The inflation data: hot where it matters
| October release | Reported | Expected | Read |
|---|---|---|---|
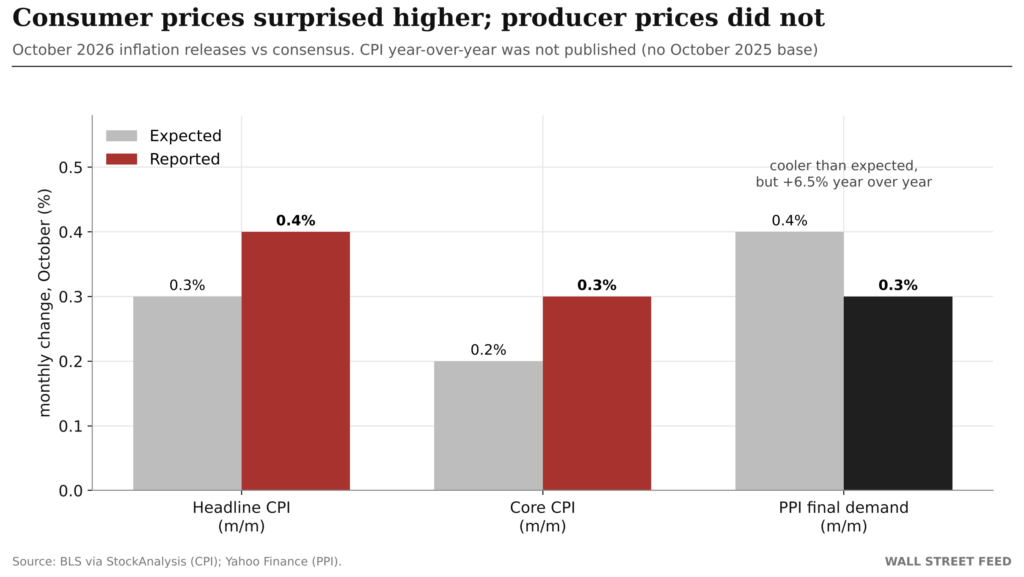
| CPI, month over month | +0.4% | +0.3% | Hotter |
| Core CPI, month over month | +0.3% | +0.2% | Hotter; third straight 0.3% |
| PPI final demand, month over month | +0.3% | +0.4% | Cooler |
| PPI, year over year | +6.5% | n/a | Highest since November 2022 |
A few details matter more than the headlines.
Core CPI was flattered. Used-car prices fell 1.2% in the month. Without that drop, core would have been closer to 0.4%. Shelter contributed more than 30% of the headline increase, and shelter is the slowest-moving component in the index. It does not reverse in a month.
There is no clean annual CPI number. Because October 2025 prices were not collected during the government shutdown, the Bureau of Labor Statistics did not publish a year-over-year rate. The last one, for September, was 3.7%. Markets are working from monthly prints, which are noisier and make each surprise matter more.
The producer side is the one to watch. October PPI was softer than forecast on the month, after a 1.3% jump in September. But at 6.5% year over year, pipeline costs are running far above consumer inflation. Either companies absorb that gap in their margins, or they pass it on. Neither outcome is good for equity valuations.
The Fed: the debate moved from 25 to 50
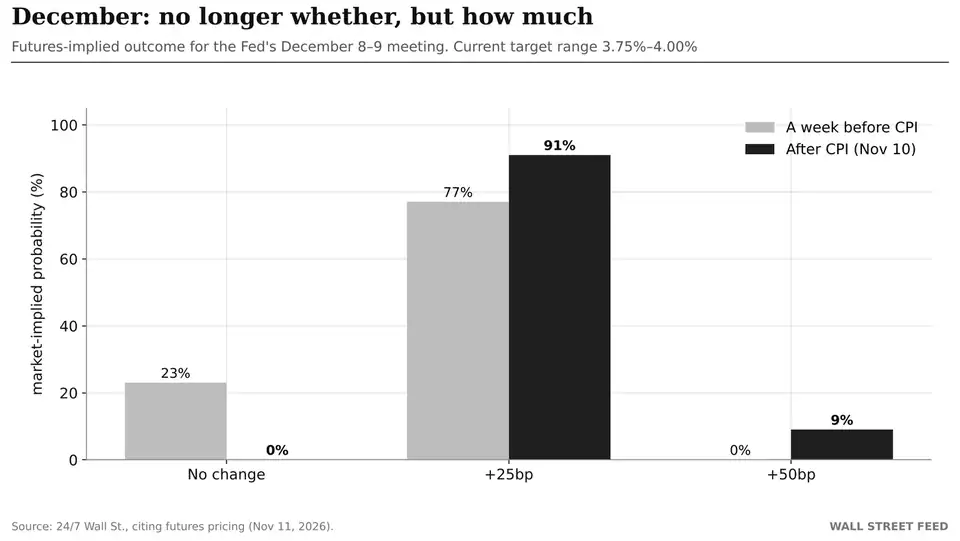
Before the CPI release, Fed Governor Christopher Waller said that if October core inflation came in around 0.3% or higher, a 50-basis-point hike in December “should be considered.” It came in at exactly 0.3%.
| December pricing (futures) | A week before CPI | After CPI |
|---|---|---|
| No change | 23% | 0% |
| +25bp | 77% | 91% |
| +50bp | 0% | 9% |
The current target range is 3.75%–4.00%, and the Fed meets December 8–9. Goldman Sachs has added another quarter-point increase to its forecast, now expected in March 2027.
The critical point is not the December move itself, which is nearly fully priced. It is that the conversation is now about the path after December. Each additional hike that enters the forecast pushes up the whole curve, and the long end is where AI valuations live.
The bond market: the 10-year crosses 5%
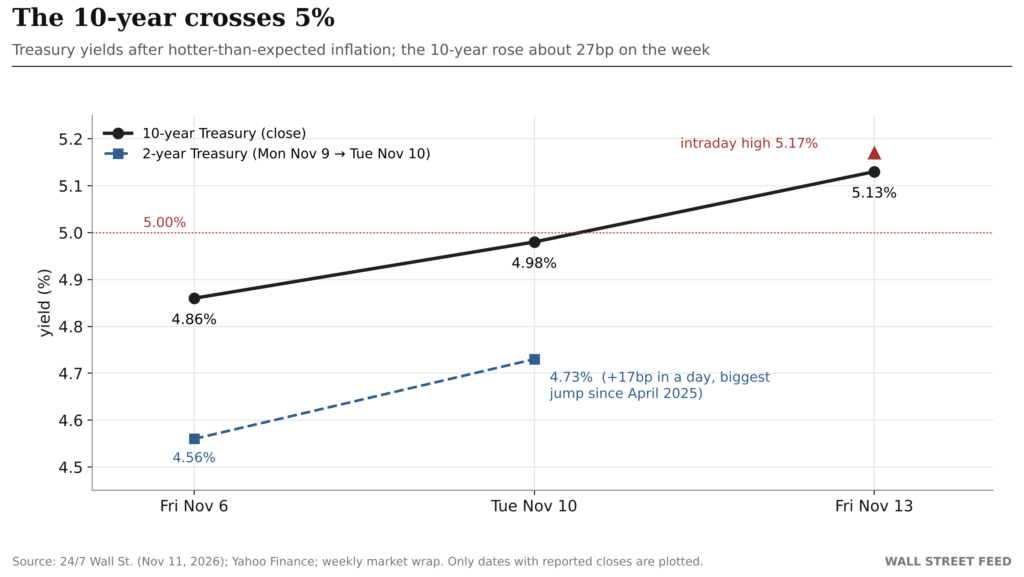
On Tuesday, November 10, the 2-year yield rose about 17 basis points to 4.73%, its largest one-day increase since April 2025. The 10-year briefly topped 5% the same day and finished the week near 5.13%, after touching 5.17% on Friday.
Why does the long end matter so much for the AI trade? Because of duration.
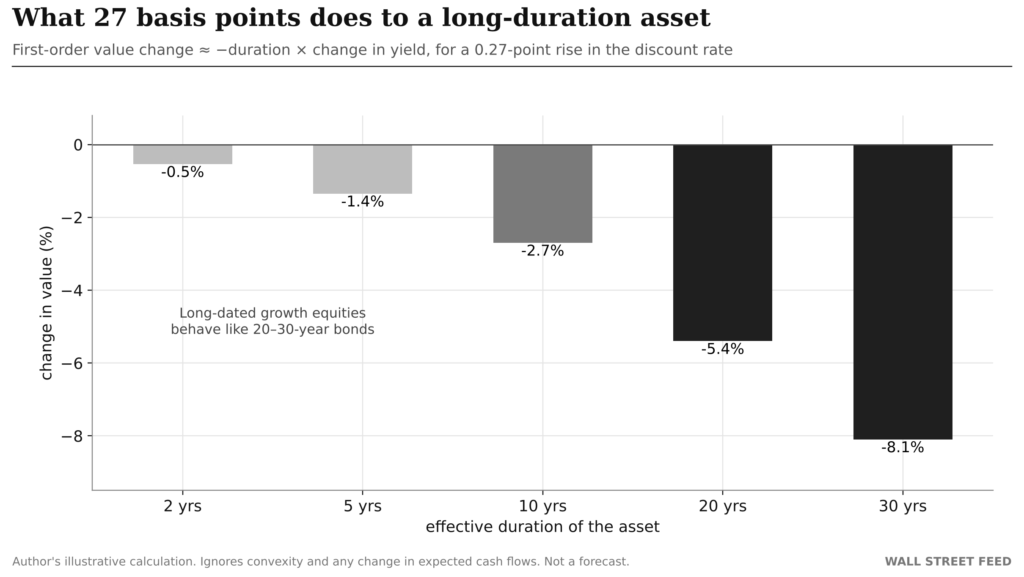
| Asset duration | Value change for +27bp |
|---|---|
| 2 years | −0.5% |
| 10 years | −2.7% |
| 20 years | −5.4% |
| 30 years | −8.1% |
An AI stock priced on profits that mostly arrive five to fifteen years from now behaves, mathematically, like a long bond. A 27bp rise in the discount rate takes roughly 5% to 8% off its fair value with nothing changing in the business. That is a sizable headwind to absorb in a single week, and it helps explain why small caps lagged and why Friday’s selling fell hardest on the Nasdaq.
The real cost of the AI build-out
This is the part of the week that matters most, and it sits in the income statements rather than the stock charts.
CoreWeave: growth funded by debt
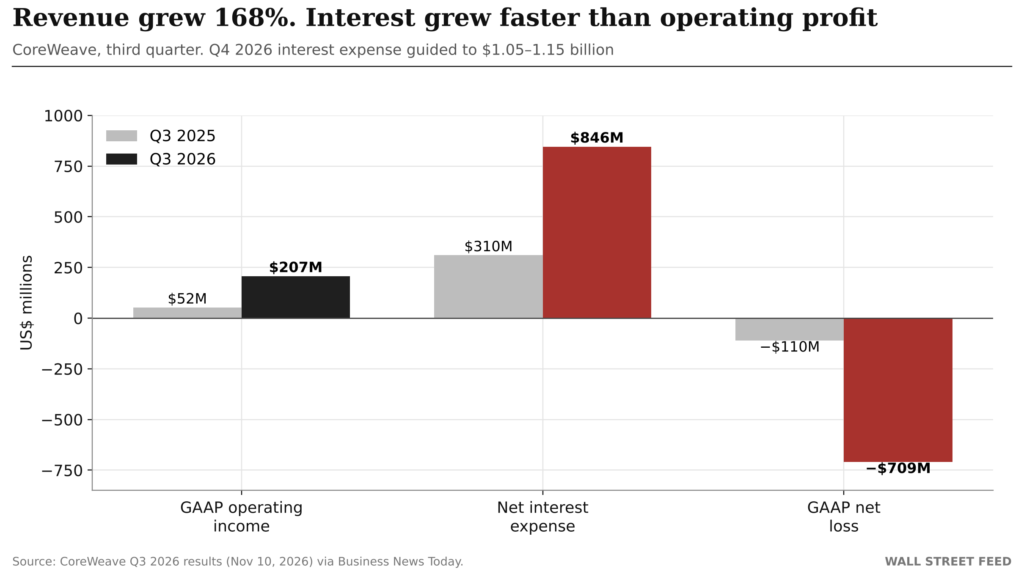
| CoreWeave, Q3 | Q3 2025 | Q3 2026 |
|---|---|---|
| Revenue | $1.37B | $3.66B (+168%) |
| Revenue backlog | n/a | $132.5B |
| GAAP operating income | $52M | $207M |
| Net interest expense | $310M | $846M |
| GAAP net loss | −$110M | −$709M |
| 2026 capex plan | $37–39B | |
| Q4 2026 interest guidance | $1.05–1.15B |
By any operating measure, this was a strong quarter. Revenue beat estimates, the backlog grew by about $28 billion in three months and full-year guidance went up. The stock rose after hours.
But look at the line below operating income. The company expects to pay more than $1 billion of interest in the fourth quarter alone, against full-year adjusted operating income guidance of about $1.3 billion. Its net interest bill grew faster than its operating profit. Total debt is approaching $47 billion.
This is the transmission channel from the bond market to the AI trade. Much of the AI build-out, especially the data-center layer, is financed with borrowed money. When the 10-year moves from 4.5% to above 5%, the hurdle rate on every new GPU cluster rises with it. A backlog of $132.5 billion is a promise of future revenue. Interest is paid in cash, every quarter, starting now.
The question for investors is no longer how much is being spent on AI. It is what return that spending must earn to cover a cost of capital that is moving higher.
Anthropic: the biggest listing, priced below the talk
| Anthropic IPO terms | |
|---|---|
| Price range | $70–$78 a share |
| Shares offered | 825 million (3% secondary) |
| Raise | about $61 billion, plus a $26 billion concurrent private placement |
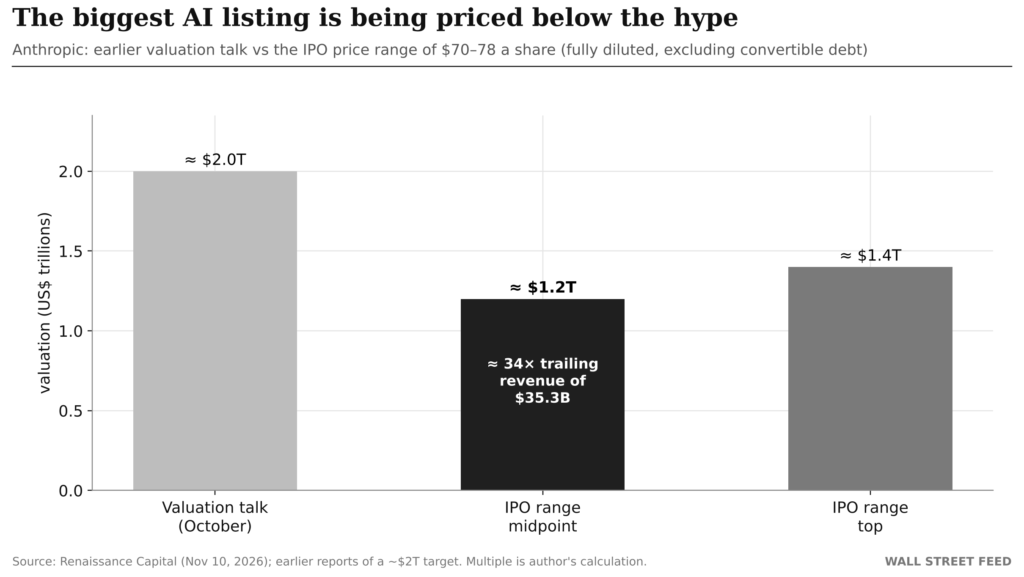
| Fully diluted value at the midpoint | about $1.2 trillion (excluding $111B of convertible debt) |
| Trailing 12-month revenue | $35.3 billion |
| Expected pricing | Week of November 16, Nasdaq ticker “ANT” |
Earlier investor talk put the valuation as high as $2 trillion, according to Reuters. The range implies roughly 34 times trailing revenue at the midpoint, still an extraordinary multiple, but a meaningful step down. In a 5% world, even the market’s most anticipated AI company is being priced with more discipline than a month ago.
One structural detail deserves attention. The concurrent private placement includes AMD, Broadcom, Google, Micron, Microsoft, Nvidia and TSMC, several of which are also major suppliers to AI developers. When suppliers invest in their customers, revenue and capital start to flow in a circle. That is not unusual in a build-out, but it makes it harder for outside investors to separate end demand from financing.
Nvidia: a governance shock at the worst possible time
Nvidia fell about 12% to 13% on the week and closed below $4 trillion in market value. On November 8 its board opened an independent investigation, overseen by independent directors with outside counsel. On Thursday, November 12, Jensen Huang resigned as president, chief executive and director, effective immediately. Chief Financial Officer Colette Kress became interim CEO while remaining CFO, and director Harvey Jones became the company’s first board chair. The stock fell as much as 14% at Thursday’s open before recovering part of the loss.
Markets can price earnings risk, and they can price rate risk. Key-person and governance risk is harder to model, especially for a company that sits at the center of the entire AI supply chain and has not yet named a permanent chief executive. The stock now goes into its earnings report next week under an interim leader, and that makes the report a bigger event than usual.
What the risk models will miss
Last week, the semiconductor index fell 12% in a day. This week, the 10-year Treasury yield rose 27 basis points. Both are regime shifts: abrupt moves from a calm environment into a stressed one. This is precisely the setting in which standard risk models are least reliable, and it is the subject of my research.
Breach frequency: When Backtests Lie
In When Backtests Lie, I show that entering a stress regime multiplies the odds of a Value-at-Risk breach by 4.80 for historical simulation and 3.49 for a machine-learning model on the S&P 500, while full-sample backtests can make those same models look acceptable. In other words, risk models break more often in exactly the weeks that look like these two.
Breach severity: When the Tail Lies Too
My newest working paper, “When the Tail Lies Too: Governance-Grade Backtesting of Expected Shortfall under Regime Shifts” (November 2026), asks the sharper question that matters for capital. Under Basel’s Fundamental Review of the Trading Book (FRTB), market-risk capital is built on the 97.5% Expected Shortfall, the average loss on the worst days. But Expected Shortfall is not directly backtestable on its own, so supervisors check the accompanying VaR instead. The number that sets capital is the least validated number in the framework.
Using daily 2000–2026 data for six assets across equities, Treasuries, currencies and Bitcoin, the paper finds:
- Stress-regime losses are understated by roughly 10% to 44%, while calm-regime severity is on target.
- The effect is structural, not noise: it is statistically significant in 83% of cases at the 97.5% capital level.
- Standard tests can pass while the model fails: in several cases the scalar ES backtest gives a clean result while the regime-conditional test detects significant stress deficiency.
- There is a fix: a transparent, regime-aware conformal recalibration brings the severity ratio back to about 1.0 and restores passing backtests on every asset.
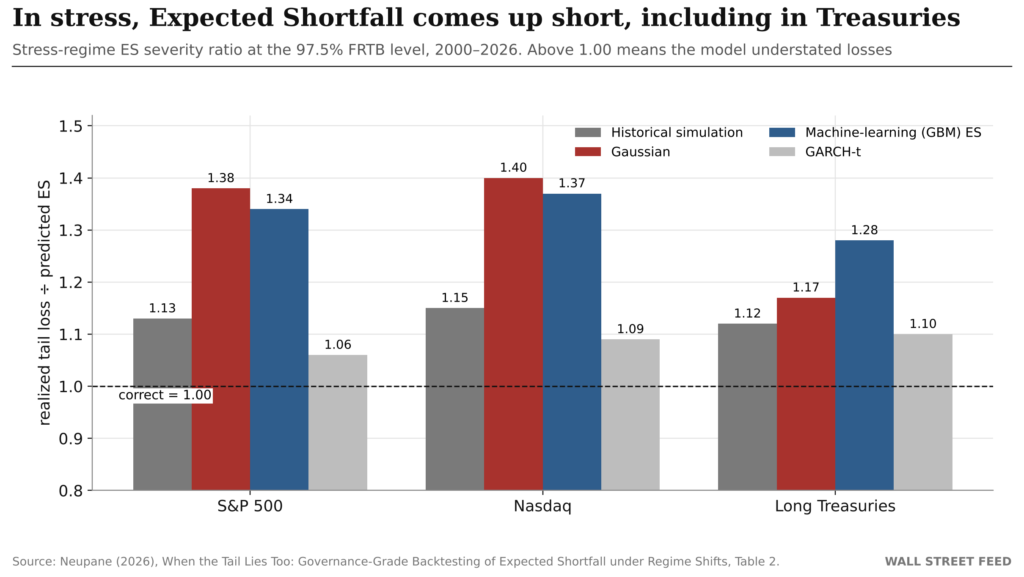
| Stress-regime ES severity ratio (97.5%) | Historical simulation | Gaussian | ML (GBM) ES | GARCH-t |
|---|---|---|---|---|
| S&P 500 | 1.13 | 1.38 | 1.34 | 1.06 |
| Nasdaq | 1.15 | 1.40 | 1.37 | 1.09 |
| Long Treasuries | 1.12 | 1.17 | 1.28 | 1.10 |
The Treasury row is the one that matters this week. Many portfolios treat long Treasuries as the low-risk ballast. The paper shows that in stress regimes, Expected Shortfall models understate tail losses on long bonds by 10% to 28%, depending on the model. In a week when the 10-year jumped 27bp, a risk report built on calm-period estimates is likely to be understating the capital needed to absorb the next move.
Put the two papers together and the message for risk managers is direct: in a regime shift, models tend to understate both how often losses arrive and how large they are. Last week’s chip crash and this week’s bond selloff are two live examples in two different asset classes.
The case for optimism, stated fairly
A critical review should argue against itself.
| Bullish reading | Bearish reading |
|---|---|
| All four indexes rose; dip buyers returned | Nvidia, the sector leader, fell ~12–13% and lost its CEO |
| PPI was cooler than expected on the month | PPI is up 6.5% year over year; core CPI is sticky at 0.3% |
| AI demand is real: CoreWeave revenue +168%, backlog $132.5B | Interest costs are growing faster than operating profit |
| Anthropic’s IPO shows deep demand for AI equity | It is priced well below earlier talk, at ~34× revenue |
| A December hike is fully priced; the surprise may be over | The debate is now 25 vs 50bp, and 2027 hikes are entering forecasts |
My assessment: AI demand is not the problem. The evidence of real spending is overwhelming. The problem is that the price of that spending, measured by the cost of capital, rose sharply this week, and many valuations were set when money was cheaper. As long as the 10-year stays above 5%, the bar every AI business has to clear is higher, and the companies that depend most on borrowed money clear it with the least room to spare.
What to watch next week
| Event | Why it matters |
|---|---|
| Nvidia earnings (Tuesday) | The first read on AI demand under interim CEO Colette Kress |
| Anthropic IPO pricing | Where it prices inside (or outside) $70–78 is a direct read on investor appetite for AI at scale |
| The 10-year at 5% | Holding above 5% keeps pressure on long-duration equities and on debt-funded AI infrastructure |
| Fed speakers | Any support for a 50bp December move would reprice the front end again |
| Credit spreads for AI infrastructure issuers | If funding costs rise faster than Treasury yields, financing risk is spreading |
The bottom line
The stock market recovered this week. The cost of money rose further. For most of the AI trade, the second fact matters more than the first.
A 5% Treasury yield changes the arithmetic of everything priced on the future. It lowers the present value of distant profits, raises the hurdle rate on every data center financed with debt, and puts more weight on the question investors have spent two years postponing: not how much is being invested in AI, but what that investment will return.
Rebounds are measured in stock prices. Recoveries are measured in the cost of capital. This week, only one of them improved.
Is a 5% Treasury yield now the biggest risk to the AI trade, or can earnings growth absorb it? Share your view.
Research behind this analysis
- When Backtests Lie: A Governance-Grade Validation Framework for Machine-Learning Value-at-Risk Models under Regime Shifts
- When the Tail Lies Too: Governance-Grade Backtesting of Expected Shortfall under Regime Shifts (working paper, November 2026) Replication code and data: github.com/nirajneupane17/es-backtesting
- Systemic Tail Episode Risk (STER) SSRN 7534899 Conditional Tail Episode Risk (CTER) · SSRN 7502499 ML-LiqVaR · SSRN 7222958 Backtesting VaR Models Under SR 11-7 · SSRN 7170418
About Wall Street Feed
Wall Street Feed covers markets, money and intelligence, one week at a time. It is founded by Niraj Neupane, CA (ICAI), Quantitative Researcher at Korvane and Financial Economist at Calderyn Institute, whose research on Value-at-Risk, Expected Shortfall, tail risk and AI model validation is published on SSRN.
Presented by Korvane | Calderyn Institute. Disclosure: the author is the founder of Korvane and Calderyn Institute. Views are the author’s own and are not investment advice.
Sources
Markets and rates
- Associated Press, How major US stock indexes fared Friday 11/13/2026: krmg.com
- Yahoo Finance, Stock market today, November 13, 2026: finance.yahoo.com
- 24/7 Wall St., The 2-year Treasury yield just had its biggest jump in 19 months (Nov 11, 2026): 247wallst.com
- investingLive, US 2-year yields surge (Nov 10, 2026): investinglive.com
Inflation
- StockAnalysis, US consumer prices rise 0.4% in October: stockanalysis.com
Companies
- NVIDIA, Statement from the Board of Directors (Nov 8, 2026): investor.nvidia.com
- TechCrunch, Nvidia’s Jensen Huang resigns (Nov 12, 2026): techcrunch.com
- AI Business, Jensen Huang’s future raises questions for AI infrastructure: aibusiness.com
- Business News Today, CoreWeave revenue surges 168% but $846M interest bill: business-news-today.com
- AI Weekly, CoreWeave Q3 revenue and debt: aiweekly.co
- Renaissance Capital, Anthropic sets terms for $61 billion IPO: www.renaissancecapital.com
- Reuters via TimesLIVE, Anthropic lowers IPO valuation target: www.timeslive.co.za
- Reuters via The Standard, Goldman adds another rate hike to Fed outlook: www.thestandard.com.hk
Research
- Neupane, N. (2026). When the Tail Lies Too: Governance-Grade Backtesting of Expected Shortfall under Regime Shifts. Working paper, November 5, 2026.
Index closes and weekly changes are from the Associated Press. The Nvidia weekly change is approximate. The duration table, valuation multiple and CoreWeave interest-to-operating-income comparison are the author’s calculations from reported figures. Expected Shortfall results are from the author’s working paper and are historical, not forecasts. Charts © Wall Street Feed.
 Full author profile →